J. Wuite et al., “Continuous Monitoring of Greenland and Antarctic Ice Sheet Velocities Using Sentinel-1 SAR,” Geophysical Research Abstracts 18 (2016), EGU2016–12826. Contains modified Copernicus Sentinel-1 data (2015), processed by Enveo Company, Austria, CC BY-SA 3.0 IGO.
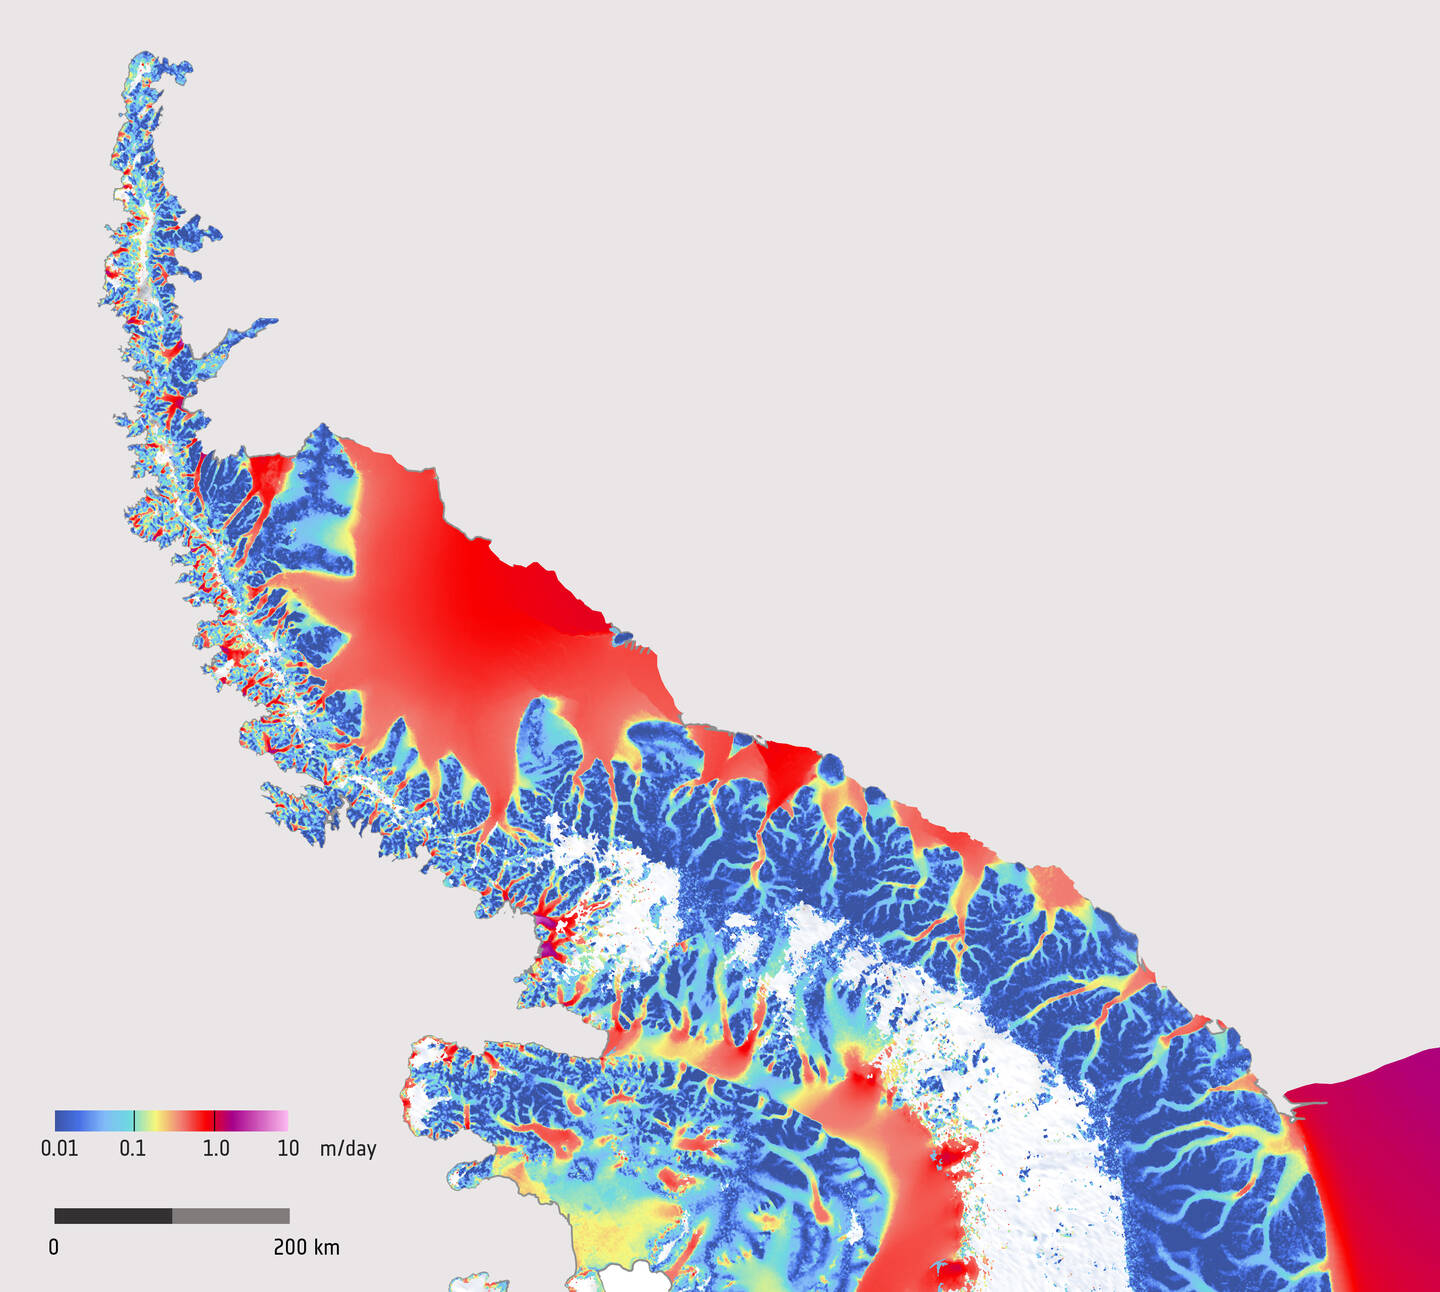
Successive radar images made between December 2014 and March 2016 were used to create this spectacular map showing how fast the ice flows on the Antarctic Peninsula. The peninsula is a narrow, mountainous finger of land and is the northernmost arm of the Antarctic ice sheet. The colors indicate the speed of ice movement in meters per day, ranging from 1 centimeter (3/8 inch) per day or less in dark blue to up to 1 meter (3.25 feet) per day in red. This region has been experiencing rapid climate warming over recent decades. May 2016.